Aim: Participation in the ASHI proficiency testing (PT) program is required for accreditation. Solid phase single antigen (SPS) testing for antibody identification is graded based on participant consensus (>89%). The aim of this study is to examine our reported but non-consensus specificities, relating MFI to the percent of labs reporting the same specificities.
Method: Performance and summary reports for ASHI PT performed 10/2020 to 12/2023 (7 PT surveys, including samples AC-525 to AC-559) were reviewed. We correlated MFI values of reported but non-consensus specificities to the percentage of labs reporting the same specificities. Our lab has removed the fluorescence divider on the Luminex™ FLEXMAP 3D™, which increases the measurable dynamic range and produces more linear MFI values. As such, specificities with > 20,000 MFI were excluded from the correlation analysis.
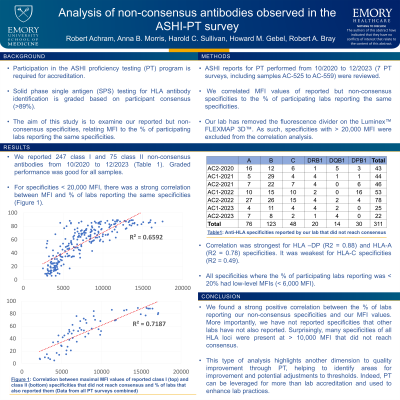
Results: We reported 247 class I and 75 class II non-consensus antibodies 10/2020 to 12/2023 (Table 1). Performance was good for all samples. For specificities < 20,000 MFI, there was a strong correlation between MFI and percent of labs reporting the same specificities: R2 was 0.66 for class I and 0.72 for class II (Figure 1). Correlation was strongest for HLA –DP (R2 = 0.88) and HLA-A (R2 = 0.78) specificities. It was weakest for HLA-C specificities (R2 = 0.49). All specificities where the percent of labs reporting was < 20% had low-level MFIs ( < 6,000 MFI). The lowest reporting percentage was 6% for only 3/322 of our non-consensus specificities.
Conclusion: This work highlights the value of looking beyond consensus in PT and leveraging the entirety of the data for quality improvement. Summary reports offer insights into antibody identification compared to peers. For our reported non-consensus specificities, we found a strong positive correlation between the percent of labs reporting and our MFI values. More importantly, we have not reported specificities that other labs have not also reported. Variability in reporting can be explained in part by differences in MFI thresholds, the kits used (One Lambda vs Lifecodes), and whether the MFI divider is enabled in the Luminex™ FLEXMAP 3D™ assay. In summary, this type of analysis provides another dimension to quality improvement through PT, helping to identify areas for improvement and potential adjustments to thresholds. Indeed, PT can be leveraged for more than lab accreditation and used to enhance lab practices.