Aim: Business intelligence (BI) software connects multiple databases and software programs for aggregating data and creating real-time reports with interactive visualization. This technology offers the capability of ongoing assessment of laboratory operations and facilitating real-time management of workflows to achieve quality thresholds. It can also provide valuable feedback to laboratory management and clients. Our aim was to develop a quality dashboard using BI software to provide real-time observations of key performance indicators (KPI) for in-house and client use.
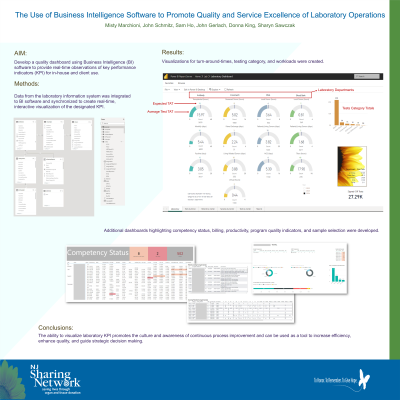
Method: Data from the laboratory information system (HistoTrac) was integrated to BI software (Power BI, Microsoft) and synchronized to create real-time, interactive visualization of the designated KPI. KPI included workload, turn-around-time (TAT), testing trends, billing, productivity, competency status, quality indicators, and patient profiles. Target goals (thresholds) for each KPI were established based on staff/testing expectations, regulatory, and contractual obligations. Dashboards for each KPI were developed that showed the average value for each KPI and the corresponding threshold. Other dashboards displayed testing volumes by assay and recipient/donor type.
Results: HistoTrac and BI were successfully integrated to generate KPI dashboards available for review 24/7 via intranet and monitors stationed within the laboratory. Each dashboard included visual representations of the KPI, the target goal, and a color change when attention to that KPI is required. Figure 1 provides a display of the TAT, testing category, and total workload dashboards. Additional dashboards highlighting competency status, billing, and productivity were developed. Patient profile dashboards were developed to automate identification of incoming samples that may be suitable for use in surrogate crossmatches for highly sensitized patients.
Conclusion: The ability to visualize laboratory KPI promotes the culture and awareness of continuous process improvement and can be used as a tool to increase efficiency, enhance quality, and guide strategic decision making. Using dashboards, we have been able to proactively initiate corrective action when needed, obtain information to swiftly answer internal and external inquiries, and identify samples to provide better patient management.