Aim: The UCLA Immunogenetics Center performs single antigen bead class I and II (SAB I/II) testing for pre/post-transplant antibody assessment. Data are acquired from sera batched in a 96-well plate, with Fusion acquisition software, and data analysis performed in Histotrac. We hypothesize that statistical modeling can identify similarity or deviation in a new result as compared to historic results indicating a change in antibody strength and specificity.
Method: For this quality improvement project, a data set of SAB I/II (n=280 Class I/II) were analyzed to determine the percentage of negative tests, and frequency/characteristics of spuriously reactive beads defined as up to 2 positive beads >1000 MFI in the absence of CREG or broad group reactivity, and considered false positive. A second set of SAB I/II data was selected for negative (n=9 class I/II) or ‘spurious’ (n=21 class I/II) reactivity. Statistical models were used to assess whether the variation in distribution of bead strength and specificity in a new result were significantly different (outside 1 or 2 standard deviations; SD) from the two prior results.
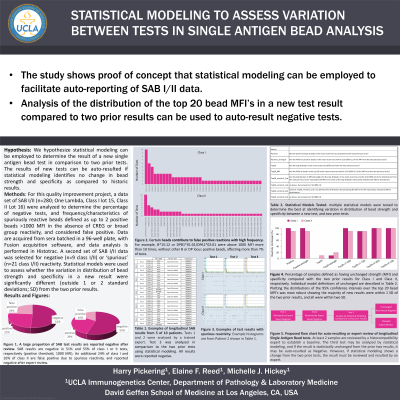
Results: SAB results were negative in 51% and 55% of class I or II tests, respectively. An additional 24% of class I and 16% of class II were false positive due to spurious reactivity. Certain beads contribute to false positive reactions with high frequency. For example, B*15:12 or DPB1*01:01/DPA1*02:01 were above 1000 MFI more than 10 times, without other B or DP locus positive beads, affecting more than 7% of tests. Reporting of a new SAB I/II result requires review of historic data to assess for changes in sensitization to HLA- even in the case of negative results. Using the second data set, multiple statistical models were tested to determine the best at identifying variation in distribution of bead strength and specificity between a new test, and two prior resulted tests. Plotting the distributions of the 95% confidence intervals over the top 20 bead MFI’s was most robust showing the majority of new results were within 1 SD of the two prior results, and all were within two SD.
Conclusion: The study shows proof of concept that statistical models comparing the distribution of the top 20 bead MFI’s in a new test result to two prior results can be used to accurately result tests with negative/spurious bead reactivities, and the potential for automated and faster analysis of SAB I/II data.

.jpg "Michelle Hickey photo")